
City Spending on Policing: Regression Analyses
By Christopher Williams
Founder, Public Health Liberation
PhD Candidate
Please send questions, suggested edits, or comments to info@publichealthliberation.com
Achieving health equity will require that public spending at all levels of government dedicate more resources to public health. The United States struggles to keep pace with positive health outcomes as its economy expands and health spending increases as compared to peer nations. Municipal governments receive less attention than do state governments and Congress in the debate on how the nation must address yawning chasms in health disparities. Analysis of the public health micro-economy is vital to gain insight into barriers that prevent the US from achieving health consistent with prediction models. In June 2020, the Vera Institute of Justice, a non-profit, published the policing budgets for 72 US cities for the 2020 fiscal year. [Source] Their report provided four key variables - overall policing budget, percent of total budget dedicated to policies, police spending per resident, and the police department employee to resident ratio. They described their methodology separately. [Source] Their research findings showed that cities vary considerable in police spending. Two cities - Billings, MT (64%), Milwaukee, WI (58%) - spent over 50% of their budget on policing. The average percentage of budget spending on policing was 29%. The average ratio of police employee to resident ratio was 1:358.
The emergence of mapping platforms such as Policy Map and Simply Analytics allows for further analysis, as users can combine economic, health, and consumer variables. This brief research report sought to maximize the use of these data to gain insight into factors associated with city spending on policing. Little is understood about the drivers of budget priorities.
Methods
I relied on the results from the Vera Institute to combine with factors from Simply Analytics. Data were downloaded on June 5, 2022. I exported 209 variables associated with the 72-city study by Vera Institute (Table 1, 2). Due to high missingness, median household data for Native Hawaiian and other Pacific Islander and American Indian were removed prior to analysis. I considered two dependent variables in linear regression analysis - percentage of city funds spent on policing and police department employee to resident ratio - in separate analyses. A correlation analysis was conducted for these variables. In regression, I controlled for the average violent crime rate per 100,000 (2020) and the average property crime rate per 100,000 (2020). 18% of the sample was missing data on these factors and were excluded from subsequent analysis. The analytic sample included 57 cities. I conducted a Forward stepwise regression since this method is optimal when variables are numerous and the theory is exploratory. (Source)
Results
57 cities were included in analysis. There was no correlation between percentage of city funds spent on policing and police department employee to resident ratio.
Model 1 - Predicting Percentage of City Funds for Policing
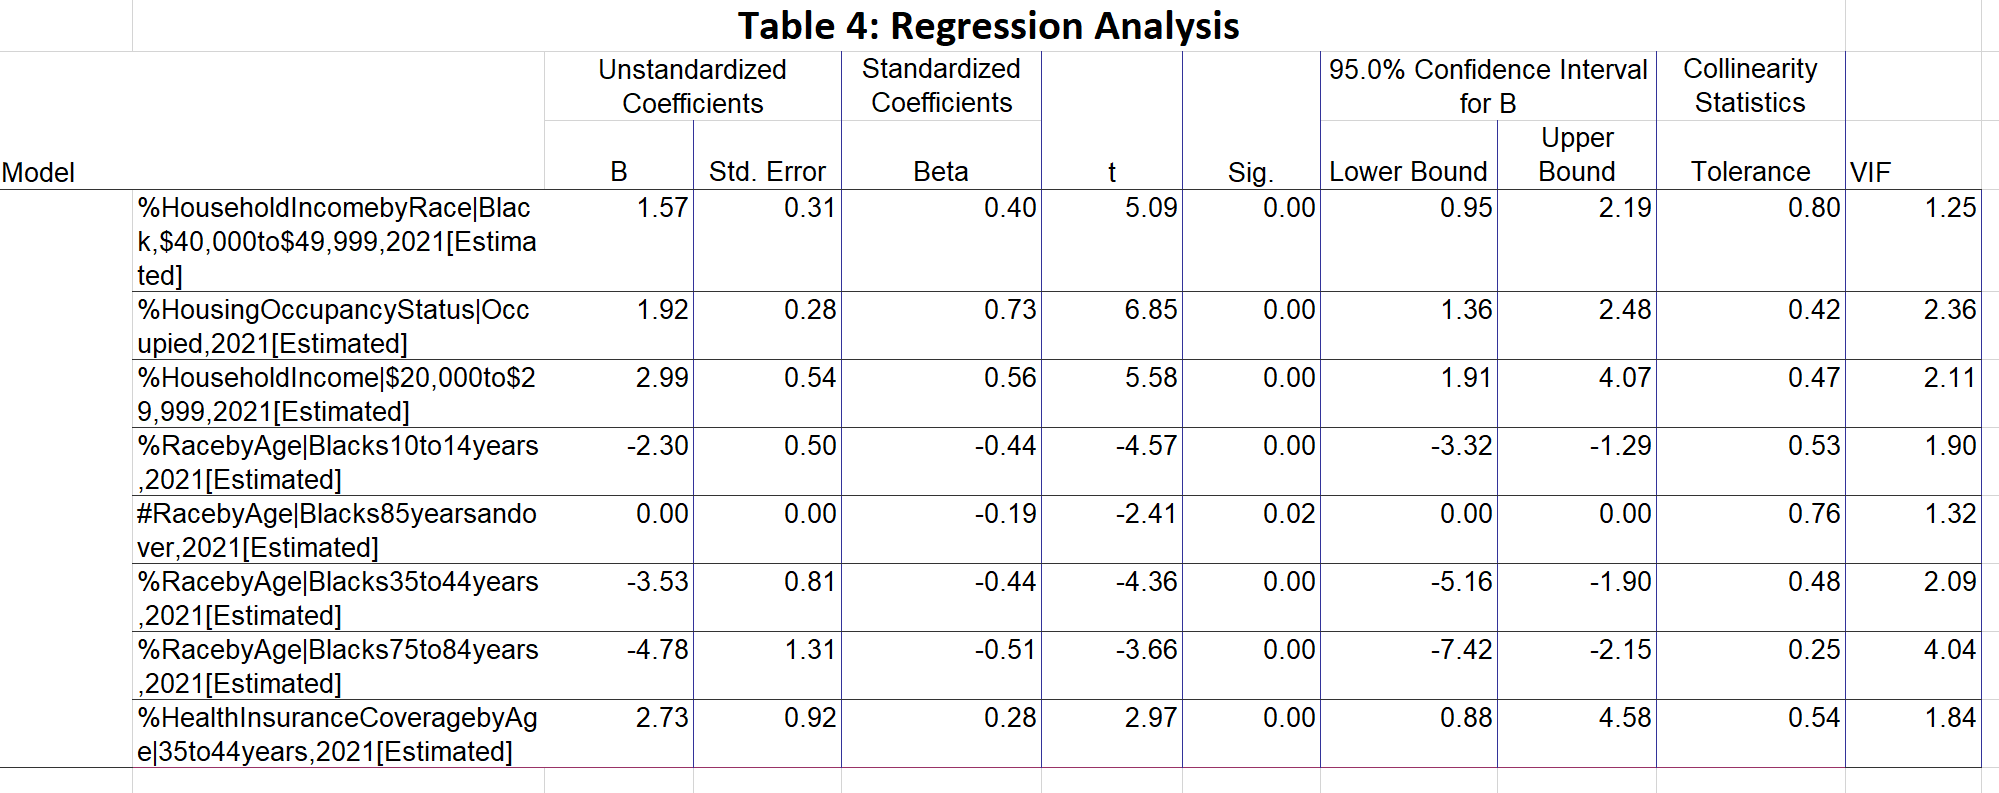
I retained the ninth and final model from the regression analysis (Table 3). Eight variables were retained - the percent of Black households between $40,000 to $49,999 household income (2021) among Blacks (1), % of occupied housing (2021)(2), % of households in the $20,000 to $29,999 range (2021)(3), % of Blacks from 10 to 14 years (2021)(4), number of Black 85 years and over (2021)(5), % of Blacks between 35 to 44 years (2021)(6), percent of Blacks between 75 and 84 years (2021)(7), and % of health insurance coverage for ages 35 to 44 years (2021)(8). The R-squared value was 0.73. The standard error of the estimate for the model fit was 5.9. The model was significant (df=10, F=16.1, p<0.001). Measures of multicollinearity indicated low multicollinearity (VIF less than 10). A histogram and normal P-P plot of the standardized residual suggest normality.
Percentage of city funds for policies was positively associated with the percent of Black households between $40,000 to $49,999 household income among Blacks (1), % of occupied housing (2), % of households in the $20,000 to $29,999 range (3), and % of health insurance coverage for ages 35 to 44 years (Table 4). It was inversely associated with % of Blacks from 10 to 14 years (4), % of Blacks between 35 to 44 years (6), and percent of Blacks between 75 and 84 years (7). The % of occupied housing (2) (B=0.73) and % of households in the $20,000 to $29,999 range (B=0.56) had the highest standardized beta coefficients.
Model 2 - Predicting Funding for Police Department Employees Per Resident
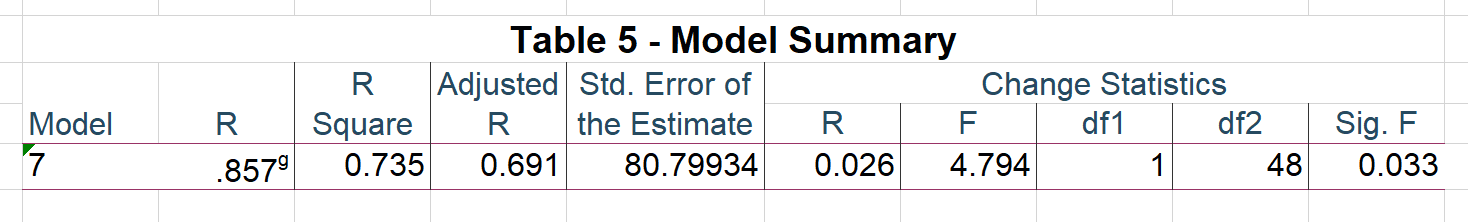
I retained the seventh and final model from the regression analysis (Table 5). Nine variables were retained Predictors: percentage of Blacks 65 years and over (1), other race median household income (2), income level $125,000 to $149,999 among whites (3), income levels of $125,000 to $149,999 (4), % of Blacks 65 years and over (5), other race median household income (6), % of White households with Income $125,000 to $149,999 (7), % of Black household with income $60,000 to $74,999 (8), and number of Whites Race 25 to 29 years (9). The R-squared value was 0.69. The standard error of the estimate for the model fit was 80.8. The model was significant (df=8, F=16.6, p<0.001). A Histogram and normal P-P plot of the standardized residual for the outcome suggest normality. Due to multicollinearity of variable (4), a linear regression including all other variables was computed. All variables were significant at a significance level of 0.05 except number of Whites Race 25 to 29 years (9).
Comparing the prior and modified regression, the adjusted R-square decreased slightly from .69 to .60. Multicollinearity likely accounted for much of this decrease. The model remained significant overall (df = 7, F=13.5, p<0.001). Other race median household income (2) and % of Black household with income $60,000 to $74,999 (8) were positively associated with the ratio. The unstandardized B for (2) was negligible (B=.007) and the highest standardized beta coefficient in absolute terms (B=0.437). Percentage of Blacks 65 years and over (1) and % of White households with Income $125,000 to $149,999 (7) were negatively correlated.
Discussion
Model 1
Of the eight significant predictors in Model 1, three were associated with age groups. All age groups were inversely associated with the percentage of the budget associated with policing. The age ranges suggest that lower percentages of children and older populations may be associated with higher spending on policing. Intuitively, this makes sense. Youth are more likely to be in school and enrolled in extracurricular activities. Older residents are likely to experience mobility challenges and differ socially and behaviorally. The implication of these findings is that a city’s make-up, even community planning and development, may be associated with how the budget on policing takes shape. A strength of this analysis is that it controlled for violence using two measures.
The age range of 35 to 44 years of age appeared twice - related to health insurance and % among the Black population. This may suggest that the 35 to 44 cohort is essential to understanding factors that give rise to increasing funding for policies. The association with health insurance may suggest a professional cohort (e.g., stable work) or a class of mid-career professionals may guard against a greater share of public funding associated with policing. The implication of research findings from Model 1 may suggest that demographic factors within cities may be important to open pathways for municipal funding for public health and away from policing.
The positive association of housing occupancy rates with the policing share of the budget implicates community factors. Further, without an adequate tax base of place-based taxpayers, cities may not have resources to invest in protective factors. Policing may be seen as a mechanism to prevent accelerated neighborhood decay.
Model 2
The second regression analysis used the department employee budget per resident. The higher this ratio means that there are fewer employees per x number of resident. The higher the ratio could be interpreted as positive for society. Data findings suggest that the percentage of an older Black population and percentage of high incomes among Whites are inversely related factors for increasing department employee budget per resident. It may provide insight that seniors hold an important key to how factors give rise to policing and public spending. The contributions of high-income earners to the tax base might mean that cities respond accordingly with larger budgets per capita. The positive association with Blacks who earn between $60,000 and $74,999 suggests a higher ratio, meaning that there are fewer police per capita.
Public Health Implication
Public health faces challenges in securing budget priorities. Often, public spending on policing garners a major share of city budgets. It is imperative for public health to understand more about budgeting to gain a foothold when engaging with policymakers. This study relied on results from regression analyses that suggested that policing funding is associated with income, age, and racial groups. Further research is needed to understand how these groups figure into policy deliberations.
Limitations
This is not a peer-reviewed study. This analysis has major limitations. Any citation should be carefully considered in light of this study’s limitations. The discussion was careful not to overly rely on the study findings.
The data from Simply Analytics that derive from estimates, meaning the actual values are not reflected in other datasets. This analysis did not account for bias estimates.
Race inherently produces bias in research due to lack of validity and imprecise measurement. As such, the study findings may not be relied upon for accuracy. In addition, the racial data for Black and White were limited to single race estimates that may have limitations for these purposes.
Due to time constraints, this analysis did not undergo full testing of assumptions for all variables prior to regression analysis. Any failure to satisfy assumptions may have biased results. We performed testing following analysis.
No analysis was conducted on missingness for dependent variables. Given the high percentage of missingness (18%), it cautions against full acceptance of the study results.
More citations are needed to support the academic rigor of this discussion.
Table 1 - List of US cities (72)
Billings, MT Milwaukee, WI Arlington, TX Long Beach, CA Kansas City, MO Tampa, FL Phoenix, AZ Austin, TX Fresno, CA Charlotte, NC Des Moines, IA Memphis, TN Little Rock, AR Omaha, NE Chicago, IL Columbus, OH San Antonio, TX Houston, TX Dallas, TX Jacksonville, FL Minneapolis, MN Fort Worth, TX Indianapolis city (balance), IN Tulsa, OK Wichita, KS Wilmington, DE San Diego, CA Colorado Springs, CO Miami, FL Los Angeles, CA Albuquerque, NM El Paso, TX Portland, OR San Jose, CA Atlanta, GA Newark, NJ Detroit, MI Boise City, ID Louisville, KY Oklahoma City, OK Tucson, AZ Jackson, MS St. Louis, MO Anchorage, AK Baltimore, MD Cheyenne, WY Sacramento, CA Charleston, WV Salt Lake City, UT New Orleans, LA Sioux Falls, SD Charleston, SC Fargo, ND Birmingham, AL Nashville-Davidson metropolitan government (balance), TN Raleigh, NC Burlington, VT Bridgeport, CT Denver, CO Honolulu County, HI Boston, MA Manchester, NH Philadelphia, PA Las Vegas, NV Seattle, WA Providence, RI Mesa, AZ San Francisco, CA Portland, ME Virginia Beach, VA New York, NY, Washington, DC
Table 2 - Variables Exported from Simply Analytics
# Total Population, 2020 [Estimated]
-
# Race | Black or African American alone, 2020 [Estimated]
% Race | White alone, 2017
# Race | Black or African American alone, 2017
# Race | White alone, 2017
% Age | 10 to 14 years, 2021 [Estimated]
% Age | 15 to 17 years, 2021 [Estimated]
% Age | 18 and 19 years, 2021 [Estimated]
% Age | 20 to 24 years, 2021 [Estimated]
% Age | 25 to 34 years, 2021 [Estimated]
% Age | 35 to 44 years, 2021 [Estimated]
% Age | 45 to 54 years, 2021 [Estimated]
% Age | 55 to 64 years, 2021 [Estimated]
% Age | 65 to 74 years, 2021 [Estimated]
% Age | 75 to 84 years, 2021 [Estimated]
# Race by Age | Whites Under 5 years, 2021 [Estimated]
# Race by Age | Whites 10 to 14 years, 2021 [Estimated]
% Race by Age | Whites 10 to 14 years, 2021 [Estimated]
# Race by Age | Whites 15 to 17 years, 2021 [Estimated]
% Race by Age | Whites 15 to 17 years, 2021 [Estimated]
# Race by Age | Whites 18 and 19 years, 2021 [Estimated]
% Race by Age | Whites 18 and 19 years, 2021 [Estimated]
# Race by Age | Whites 20 to 24 years, 2021 [Estimated]
% Race by Age | Whites 20 to 24 years, 2021 [Estimated]
# Race by Age | Whites 25 to 29 years, 2021 [Estimated]
% Race by Age | Whites 25 to 29 years, 2021 [Estimated]
# Race by Age | Whites 30 to 34 years, 2021 [Estimated]
% Race by Age | Whites 30 to 34 years, 2021 [Estimated]
# Race by Age | Whites 35 to 44 years, 2021 [Estimated]
% Race by Age | Whites Under 5 years, 2021 [Estimated]
# Race by Age | Whites 5 to 9 years, 2021 [Estimated]
% Race by Age | Whites 5 to 9 years, 2021 [Estimated]
% Race by Age | Whites 35 to 44 years, 2021 [Estimated]
# Race by Age | Whites 45 to 54 years, 2021 [Estimated]
% Race by Age | Whites 45 to 54 years, 2021 [Estimated]
# Race by Age | Whites 55 to 64 years, 2021 [Estimated]
% Race by Age | Whites 55 to 64 years, 2021 [Estimated]
# Race by Age | Whites 65 to 74 years, 2021 [Estimated]
% Race by Age | Whites 65 to 74 years, 2021 [Estimated]
# Race by Age | Whites 75 to 84 years, 2021 [Estimated]
% Race by Age | Whites 75 to 84 years, 2021 [Estimated]
# Race by Age | Whites 65 years and over, 2021 [Estimated]
% Race by Age | Whites 65 years and over, 2021 [Estimated]
# Race by Age | Whites 85 years and over, 2021 [Estimated]
% Race by Age | Whites 85 years and over, 2021 [Estimated]
# Race | Total population, 2021 [Estimated]
# Race | White alone, 2021 [Estimated]
% Race | White alone, 2021 [Estimated]
# Race | Black or African American alone, 2021 [Estimated]
% Race | Black or African American alone, 2021 [Estimated]
# Race | American Indian and Alaska Native alone, 2021 [Estimated]
% Race | American Indian and Alaska Native alone, 2021 [Estimated]
# Race | Asian alone, 2021 [Estimated]
% Race | Asian alone, 2021 [Estimated]
# Race | Native Hawaiian and Other Pacific Islander alone, 2021 [Estimated]
% Race | Native Hawaiian and Other Pacific Islander alone, 2021 [Estimated]
# Race | Some other race alone, 2021 [Estimated]
% Race | Some other race alone, 2021 [Estimated]
# Race | Two or more races, 2021 [Estimated]
% Race | Two or more races, 2021 [Estimated]
# Race by Sex | People who are White alone, 2021 [Estimated]
# Race by Sex | White Males, 2021 [Estimated]
% Race by Sex | White Males, 2021 [Estimated]
# Race by Sex | White Females, 2021 [Estimated]
% Race by Sex | White Females, 2021 [Estimated]
# Race by Sex | Black or African American alone, 2021 [Estimated]
# Race by Sex | Black Males, 2021 [Estimated]
% Race by Sex | Black Males, 2021 [Estimated]
# Race by Sex | Black Females, 2021 [Estimated]
% Race by Sex | Black Females, 2021 [Estimated]
# Race by Sex | People who are Asian alone, 2021 [Estimated]
# Race by Sex | Asian Males, 2021 [Estimated]
% Race by Sex | Asian Males, 2021 [Estimated]
# Race by Sex | Asian Females, 2021 [Estimated]
% Race by Sex | Asian Females, 2021 [Estimated]
# Race by Sex | White alone, not Hispanic or Latino population, 2021 [Estimated]
# Race by Sex | White non-Hispanic Males, 2021 [Estimated]
% Race by Sex | White non-Hispanic Males, 2021 [Estimated]
# Race by Sex | White non-Hispanic Females, 2021 [Estimated]
% Race by Sex | White non-Hispanic Females, 2021 [Estimated]
# Race by Age | Black or African American alone, 2021 [Estimated]
# Race by Age | Blacks Under 5 years, 2021 [Estimated]
% Race by Age | Blacks Under 5 years, 2021 [Estimated]
# Race by Age | Blacks 5 to 9 years, 2021 [Estimated]
% Race by Age | Blacks 5 to 9 years, 2021 [Estimated]
# Race by Age | Blacks 10 to 14 years, 2021 [Estimated]
% Race by Age | Blacks 10 to 14 years, 2021 [Estimated]
# Race by Age | Blacks 15 to 17 years, 2021 [Estimated]
% Race by Age | Blacks 15 to 17 years, 2021 [Estimated]
# Race by Age | Blacks 18 and 19 years, 2021 [Estimated]
% Race by Age | Blacks 18 and 19 years, 2021 [Estimated]
# Race by Age | Blacks 20 to 24 years, 2021 [Estimated]
% Race by Age | Blacks 20 to 24 years, 2021 [Estimated]
# Race by Age | Blacks 25 to 29 years, 2021 [Estimated]
% Race by Age | Blacks 25 to 29 years, 2021 [Estimated]
# Race by Age | Blacks 30 to 34 years, 2021 [Estimated]
% Race by Age | Blacks 30 to 34 years, 2021 [Estimated]
# Race by Age | Blacks 35 to 44 years, 2021 [Estimated]
% Race by Age | Blacks 35 to 44 years, 2021 [Estimated]
# Race by Age | Blacks 45 to 54 years, 2021 [Estimated]
% Race by Age | Blacks 45 to 54 years, 2021 [Estimated]
# Race by Age | Blacks 55 to 64 years, 2021 [Estimated]
% Race by Age | Blacks 55 to 64 years, 2021 [Estimated]
# Race by Age | Blacks 65 to 74 years, 2021 [Estimated]
% Race by Age | Blacks 65 to 74 years, 2021 [Estimated]
# Race by Age | Blacks 75 to 84 years, 2021 [Estimated]
% Race by Age | Blacks 75 to 84 years, 2021 [Estimated]
# Race by Age | Blacks 65 years and over, 2021 [Estimated]
% Race by Age | Blacks 65 years and over, 2021 [Estimated]
# Race by Age | Blacks 85 years and over, 2021 [Estimated]
% Race by Age | Blacks 85 years and over, 2021 [Estimated]
Healthcare, 2022
Healthcare | Medical services | Physician's services, 2022
Healthcare | Medical services | Dental services, 2022
Healthcare | Medical services | Eyecare services, 2022
Healthcare | Drugs, 2022
Healthcare | Drugs | Nonprescription drugs, 2022
# Health Insurance Coverage by Age | Civilian noninstitutionalized population, 2021 [Estimated]
# Health Insurance Coverage by Age | 6 to 18 years, 2021 [Estimated]
% Health Insurance Coverage by Age | 6 to 18 years, 2021 [Estimated]
# Health Insurance Coverage by Age | 19 to 25 years, 2021 [Estimated]
% Health Insurance Coverage by Age | 19 to 25 years, 2021 [Estimated]
# Health Insurance Coverage by Age | 26 to 34 years, 2021 [Estimated]
% Health Insurance Coverage by Age | 26 to 34 years, 2021 [Estimated]
# Health Insurance Coverage by Age | 35 to 44 years, 2021 [Estimated]
% Health Insurance Coverage by Age | 35 to 44 years, 2021 [Estimated]
# Health Insurance Coverage by Age | 45 to 54 years With health insurance coverage, 2021 [Estimated]
% Health Insurance Coverage by Age | 45 to 54 years With health insurance coverage, 2021 [Estimated]
# Health Insurance Coverage by Age | 55 to 64 years, 2021 [Estimated]
% Health Insurance Coverage by Age | 55 to 64 years, 2021 [Estimated]
% Geographical Mobility | Same house 1 year ago, 2021 [Estimated]
% Housing Occupancy Status | Occupied, 2021 [Estimated]
% Housing Occupancy Status | Vacant, 2021 [Estimated]
% Housing Tenure | Owner occupied, 2021 [Estimated]
% Housing Tenure | Renter occupied, 2021 [Estimated]
# Housing Tenure by Race | White, Owner occupied, 2021 [Estimated]
% Housing Tenure by Race | White, Owner occupied, 2021 [Estimated]
# Housing Tenure by Race | White, Renter occupied, 2021 [Estimated]
% Housing Tenure by Race | White, Renter occupied, 2021 [Estimated]
# Housing Tenure by Race | Occupied housing units with a householder who is White alone, 2021 [Estimated]
# Housing Tenure by Race | Occupied housing units with a householder who is Black or African American alone, 2021 [Estimated]
# Housing Tenure by Race | Black, Owner occupied, 2021 [Estimated]
% Housing Tenure by Race | Black, Owner occupied, 2021 [Estimated]
# Housing Tenure by Race | Black, Renter occupied, 2021 [Estimated]
% Housing Tenure by Race | Black, Renter occupied, 2021 [Estimated]
% Citizenship Status | U.S. citizen by naturalization, 2021 [Estimated]
% Citizenship Status | Not a U.S. citizen, 2021 [Estimated]
% Place of Birth | Foreign born, 2021 [Estimated]
% Place Of Birth By Poverty Status In The Past 12 Months In The United States [B06012] | Population in the United States for whom poverty status is determined | Below 100 percent of the poverty level, 2019
% Place Of Birth By Poverty Status In The Past 12 Months In The United States [B06012] | Population in the United States for whom poverty status is determined | 100 to 149 percent of the poverty level, 2019
% Educational Attainment | Less than high school diploma, 2021 [Estimated]
% Educational Attainment | High school graduate (includes equivalency), 2021 [Estimated]
% Educational Attainment | Some college, 2021 [Estimated]
% Educational Attainment | Associate's degree, 2021 [Estimated]
% Educational Attainment | Bachelor's degree, 2021 [Estimated]
% Educational Attainment | Master's degree, 2021 [Estimated]
% Educational Attainment | Professional school degree, 2021 [Estimated]
% Educational Attainment | Doctorate degree, 2021 [Estimated]
Median Household Income, 2021 [Estimated]
White Median Household Income, 2021 [Estimated]
Black Median Household Income, 2021 [Estimated]
American Indian and Alaska Native Median Household Income, 2021 [Estimated]
Asian Median Household Income, 2021 [Estimated]
Native Hawaiian and Other Pacific Islander Median Household Income, 2021 [Estimated]
Other Race Median Household Income, 2021 [Estimated]
Two or More Races Median Household Income, 2021 [Estimated]
White non-Hispanic Median Household Income, 2021 [Estimated]
Hispanic or Latino Median Household Income, 2021 [Estimated]
% Household Income | Less than $10,000, 2021 [Estimated]
% Household Income | $10,000 to $19,999, 2021 [Estimated]
% Household Income | $20,000 to $29,999, 2021 [Estimated]
% Household Income | $30,000 to $39,999, 2021 [Estimated]
% Household Income | $40,000 to $49,999, 2021 [Estimated]
% Household Income | $50,000 to $59,999, 2021 [Estimated]
% Household Income | $60,000 to $74,999, 2021 [Estimated]
% Household Income | $75,000 to $99,999, 2021 [Estimated]
% Household Income | $100,000 to $124,999, 2021 [Estimated]
% Household Income | $125,000 to $149,999, 2021 [Estimated]
% Household Income | $150,000 to $199,999, 2021 [Estimated]
% Household Income | $100,000 or more, 2021 [Estimated]
% Household Income | $200,000 or more, 2021 [Estimated]
% Household Income by Race | White, Less than $10,000, 2021 [Estimated]
% Household Income by Race | White, $10,000 to $19,999, 2021 [Estimated]
% Household Income by Race | White, $20,000 to $29,999, 2021 [Estimated]
% Household Income by Race | White, $30,000 to $39,999, 2021 [Estimated]
% Household Income by Race | White, $40,000 to $49,999, 2021 [Estimated]
% Household Income by Race | White, $50,000 to $59,999, 2021 [Estimated]
% Household Income by Race | White, $60,000 to $74,999, 2021 [Estimated]
% Household Income by Race | White, $75,000 to $99,999, 2021 [Estimated]
% Household Income by Race | White, $100,000 to $124,999, 2021 [Estimated]
% Household Income by Race | White, $125,000 to $149,999, 2021 [Estimated]
% Household Income by Race | White, $150,000 to $199,999, 2021 [Estimated]
% Household Income by Race | White, $100,000 or more, 2021 [Estimated]
% Household Income by Race | White, $200,000 or more, 2021 [Estimated]
% Household Income by Race | Black, Less than $10,000, 2021 [Estimated]
% Household Income by Race | Black, $10,000 to $19,999, 2021 [Estimated]
% Household Income by Race | Black, $20,000 to $29,999, 2021 [Estimated]
% Household Income by Race | Black, $30,000 to $39,999, 2021 [Estimated]
% Household Income by Race | Black, $40,000 to $49,999, 2021 [Estimated]
% Household Income by Race | Black, $50,000 to $59,999, 2021 [Estimated]
% Household Income by Race | Black, $60,000 to $74,999, 2021 [Estimated]
% Household Income by Race | Black, $75,000 to $99,999, 2021 [Estimated]
% Household Income by Race | Black, $100,000 to $124,999, 2021 [Estimated]
% Household Income by Race | Black, $125,000 to $149,999, 2021 [Estimated]
% Household Income by Race | Black, $150,000 to $199,999, 2021 [Estimated]
% Household Income by Race | Black, $100,000 or more, 2021 [Estimated]
% Household Income by Race | Black, $200,000 or more, 2021 [Estimated]
Average Violent Crime Rate (per 100,000), 2020
Average Property Crime Rate (per 100,000), 2020